의학서적전문 "성보의학서적"의 신간의학도서입니다.
그동안 <="" span="">데이터 시각화>를 아껴 주셔서 감사합니다. 3권이면 충분하다고 생각했었는데, 4권을 쓰고 있군요. 책을 쓰는 것은 정말 즐거운 일입니다. 더군다나 독자들이 아끼고 사랑해 주고 가끔 학회에서나 강의 때, 책의 독자분으로부터 인사를 받게 되면 더욱 기쁘기도 합니다. 예쁘고 훌륭한 차트를 만드는 것은 재미있고, 이것을 사용해서 발표하거나 논문을 쓰거나 책을 쓰게 될 독자들을 생각하면 기쁨이 배가 됩니다.
R은 훌륭하고 예쁜 시각화 도구를 만들어 내기에 좋은 도구로 알려져 있지만, 코딩을 모르는 사람은 배우기 어려운 단점이 있어서 이 책을 통해 코딩의 개념 없이도 R의 결과물을 쉽게 얻을 수 있습니다. 가능한 많은 옵션을 넣으려고 했지만, 그러다 보면 너무 복잡해지기에 공통으로 필요한 부분만 넣었습니다.
데이터는 금광이라고 합니다. 미국의 신대륙을 금을 발견하려고 갔던 사람들은 위험하기도 하고 어렵기도 했을 텐데, 지금의 금광은 어렵지도 않고 위험하지도 않습니다. 재미있기까지 합니다.
2018년 9월 공개된 데이터셋 서치(https://datasetsearch.research.google.com/)가 2020년 1월 베타 딱지를 떼고 정식 서비스화했을 뿐 아니라, 수많은 공개 데이터들이 있고, 이를 이용해서 분석하고 시각화하는 경연대회가 있습니다. 제가 어릴 때는 주산대회, 웅변대회가 있었다면 지금은 데이터 분석대회가 있습니다. 어린 학생들조차도 데이터를 분석하고 다루고 해결하는 능력을 기르도록 장려하는 세상이 된 것입니다.
2022년 9월
김지형
- 미리보기 -

-도서목차-
PART 1 일러두기
1-1. 사용법
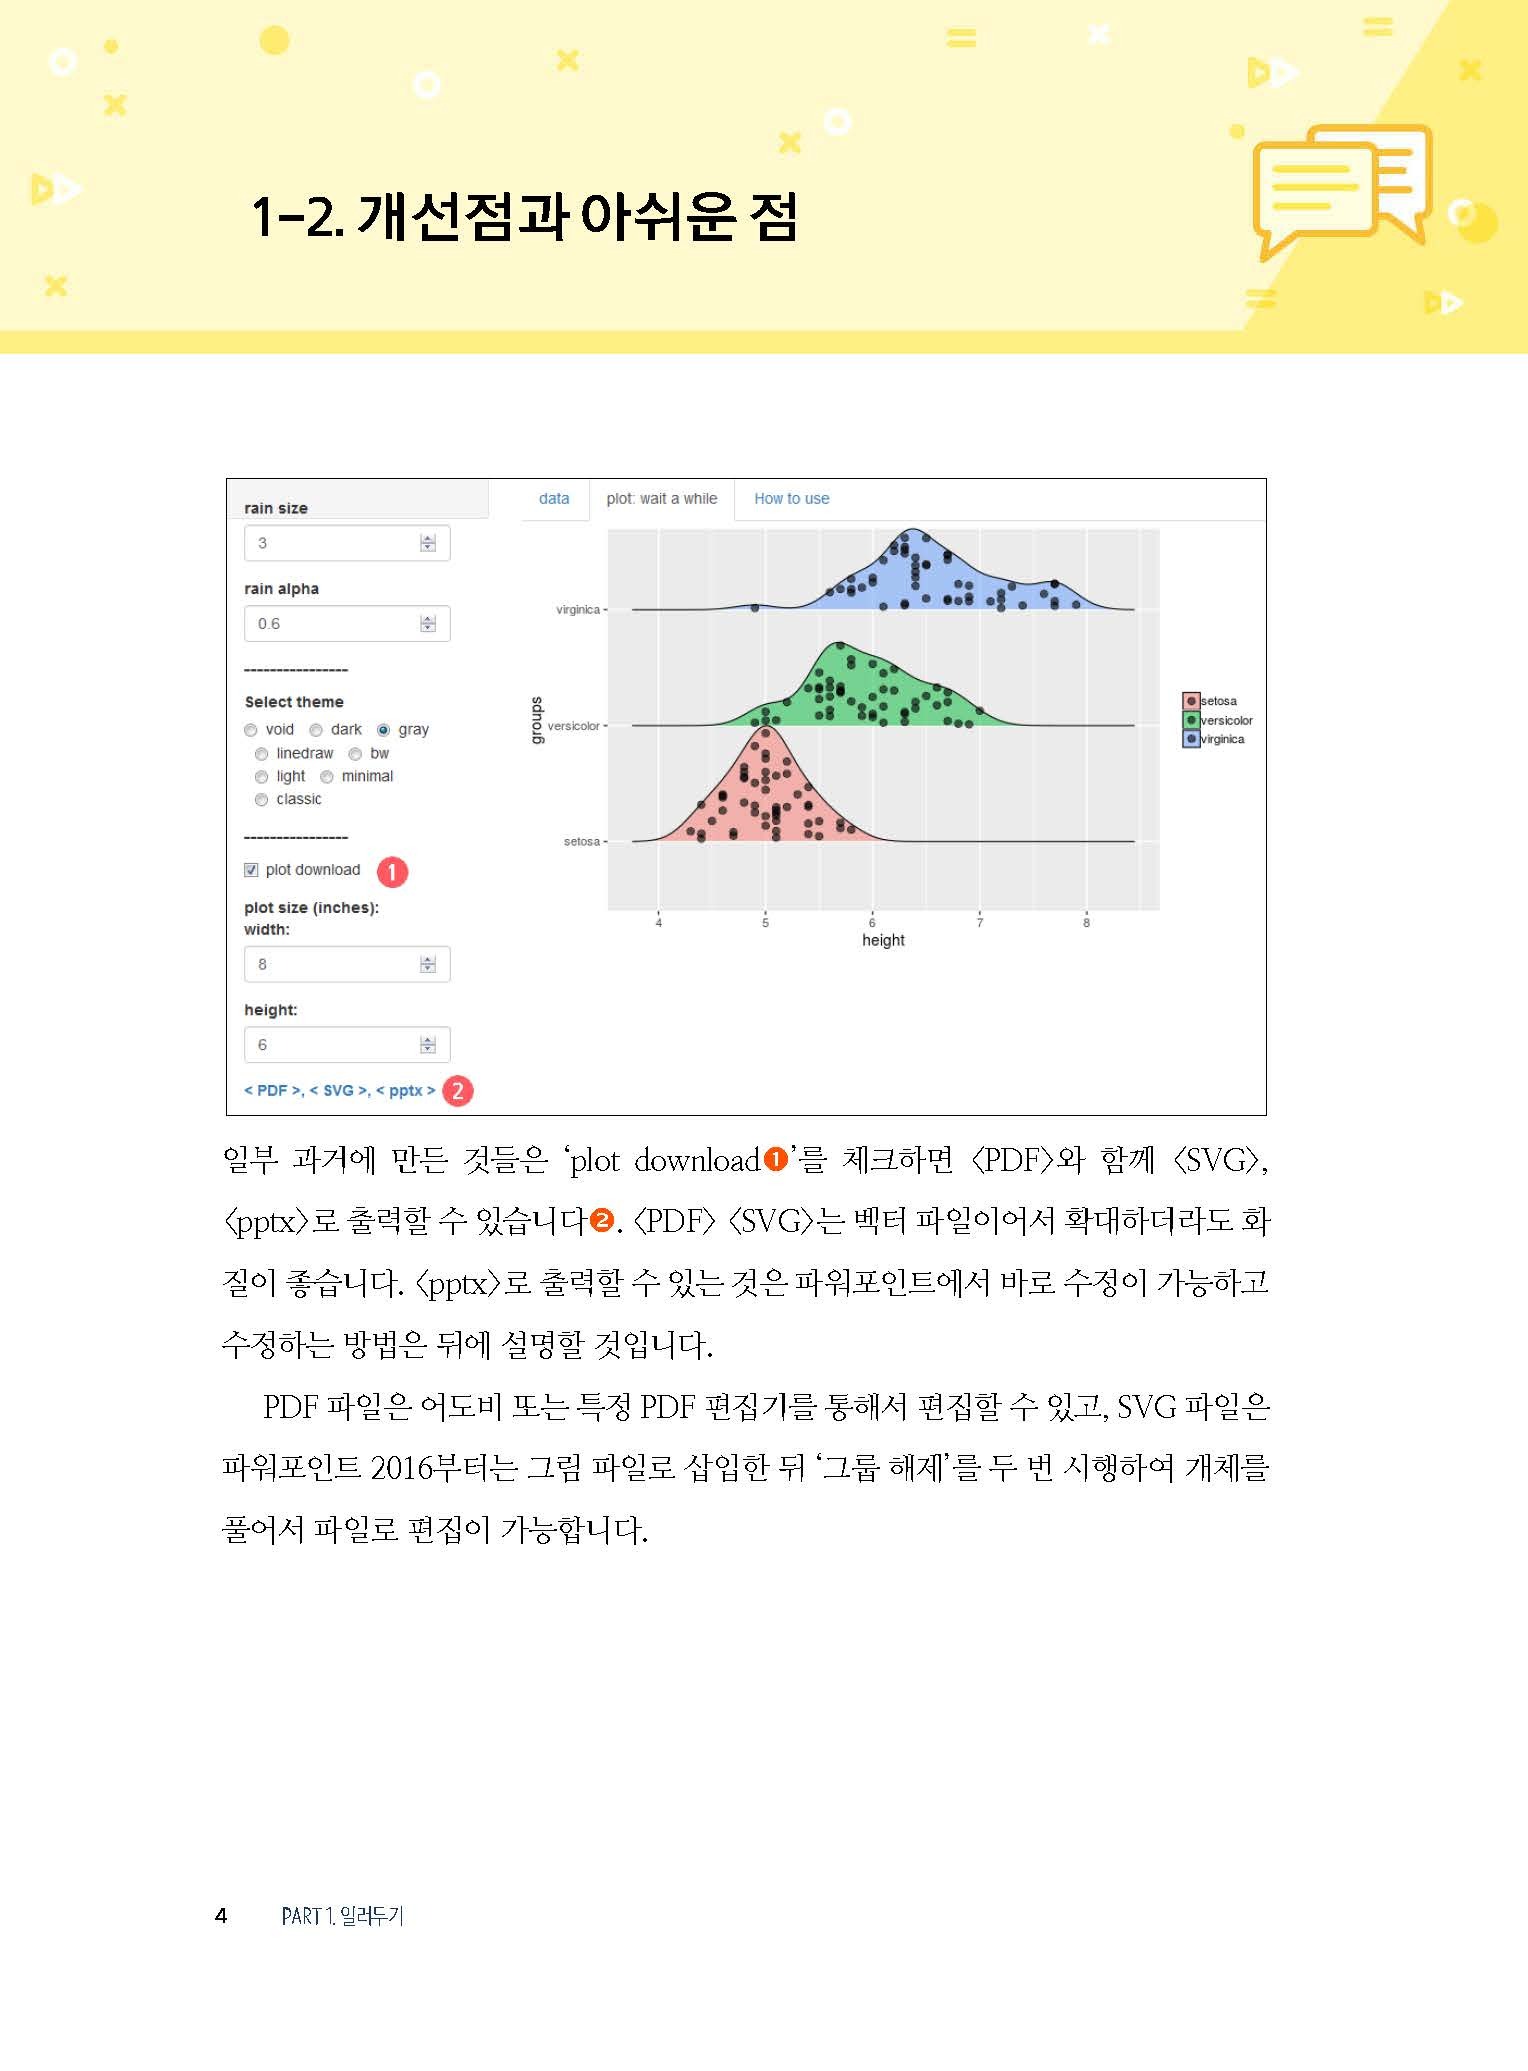
1-2. 개선점과 아쉬운 점
1-3. CSV 파일로 저장하기
1-4. 연결되지 않을 때
PART 2 다양한 plot
2-1. Dendro Bubble Plot
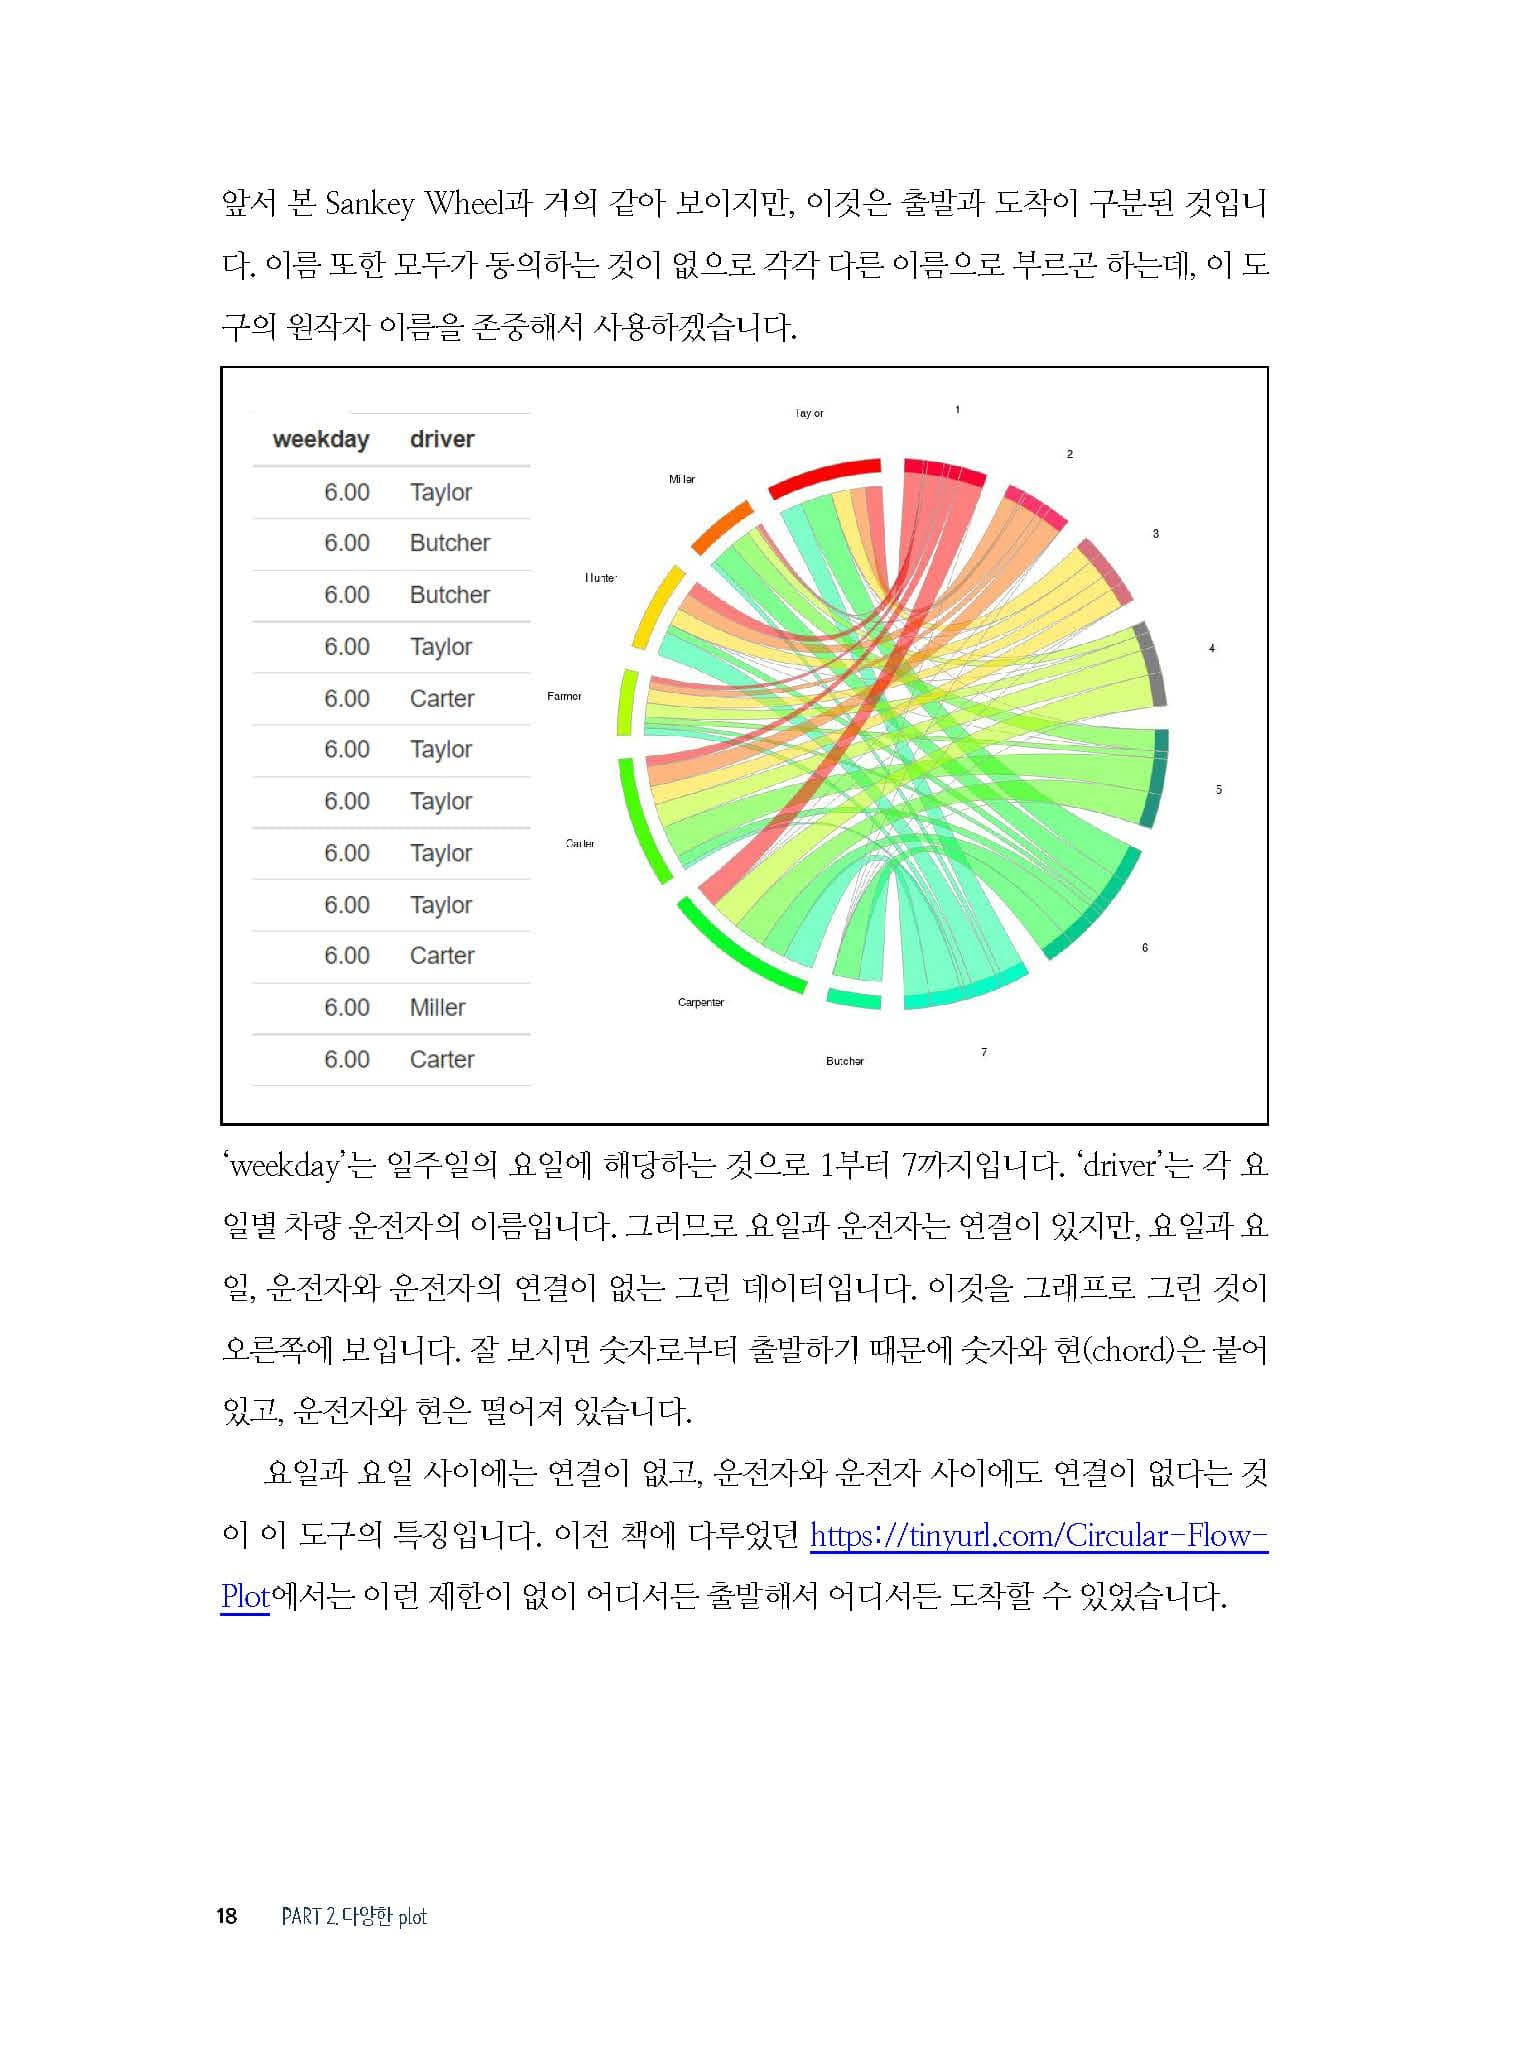
2-2. Circular Chord diagram
2-3. Sankey Wheel
2-4. Sankey Flow
2-5. D) Alluvial Diagrams
2-6. Level Flow Chart
2-7. Corset Plot
2-8. Quadrant Scatter Plot
2-9. Quiver(vector) Plots
2-10. Czekanowski’s Diagram
2-11. Funnel Plot for Proportion
2-12. Color Table
2-13. Multi Regression Fit
2-14. Q-Q Boxplot
2-15. Pearson correlation with CI
2-16. Common Structures of Bias
2-17. Pair Plot
2-18. Epidemiological Contacts
2-19. R Pivot Table & Plot
2-20. Combination Count Plot(II)
2-21. Venn Diagram(IV)
2-22. Venn Diagram(III)
2-23. Bipartite Network Plot
2-24. Life Zones Triangle
2-25. Isotonic Regression
2-26. Grouped Box Plot
2-27. Bag Plot
2-28. Elliplot
2-29. Conditioning Plot(II)
2-30. Multiple Duoplot
2-31. Letter Plot
2-32. Stem Leaves
2-33. Inequality and Poverty
2-34. Grouped Stack Barplot
2-35. Linear/Nonlinear Regression
2-36. Confusion Matrix Plot
2-37. 2D Density Plot
2-38. QR code generator
PART 3 시간과 관련된 차트
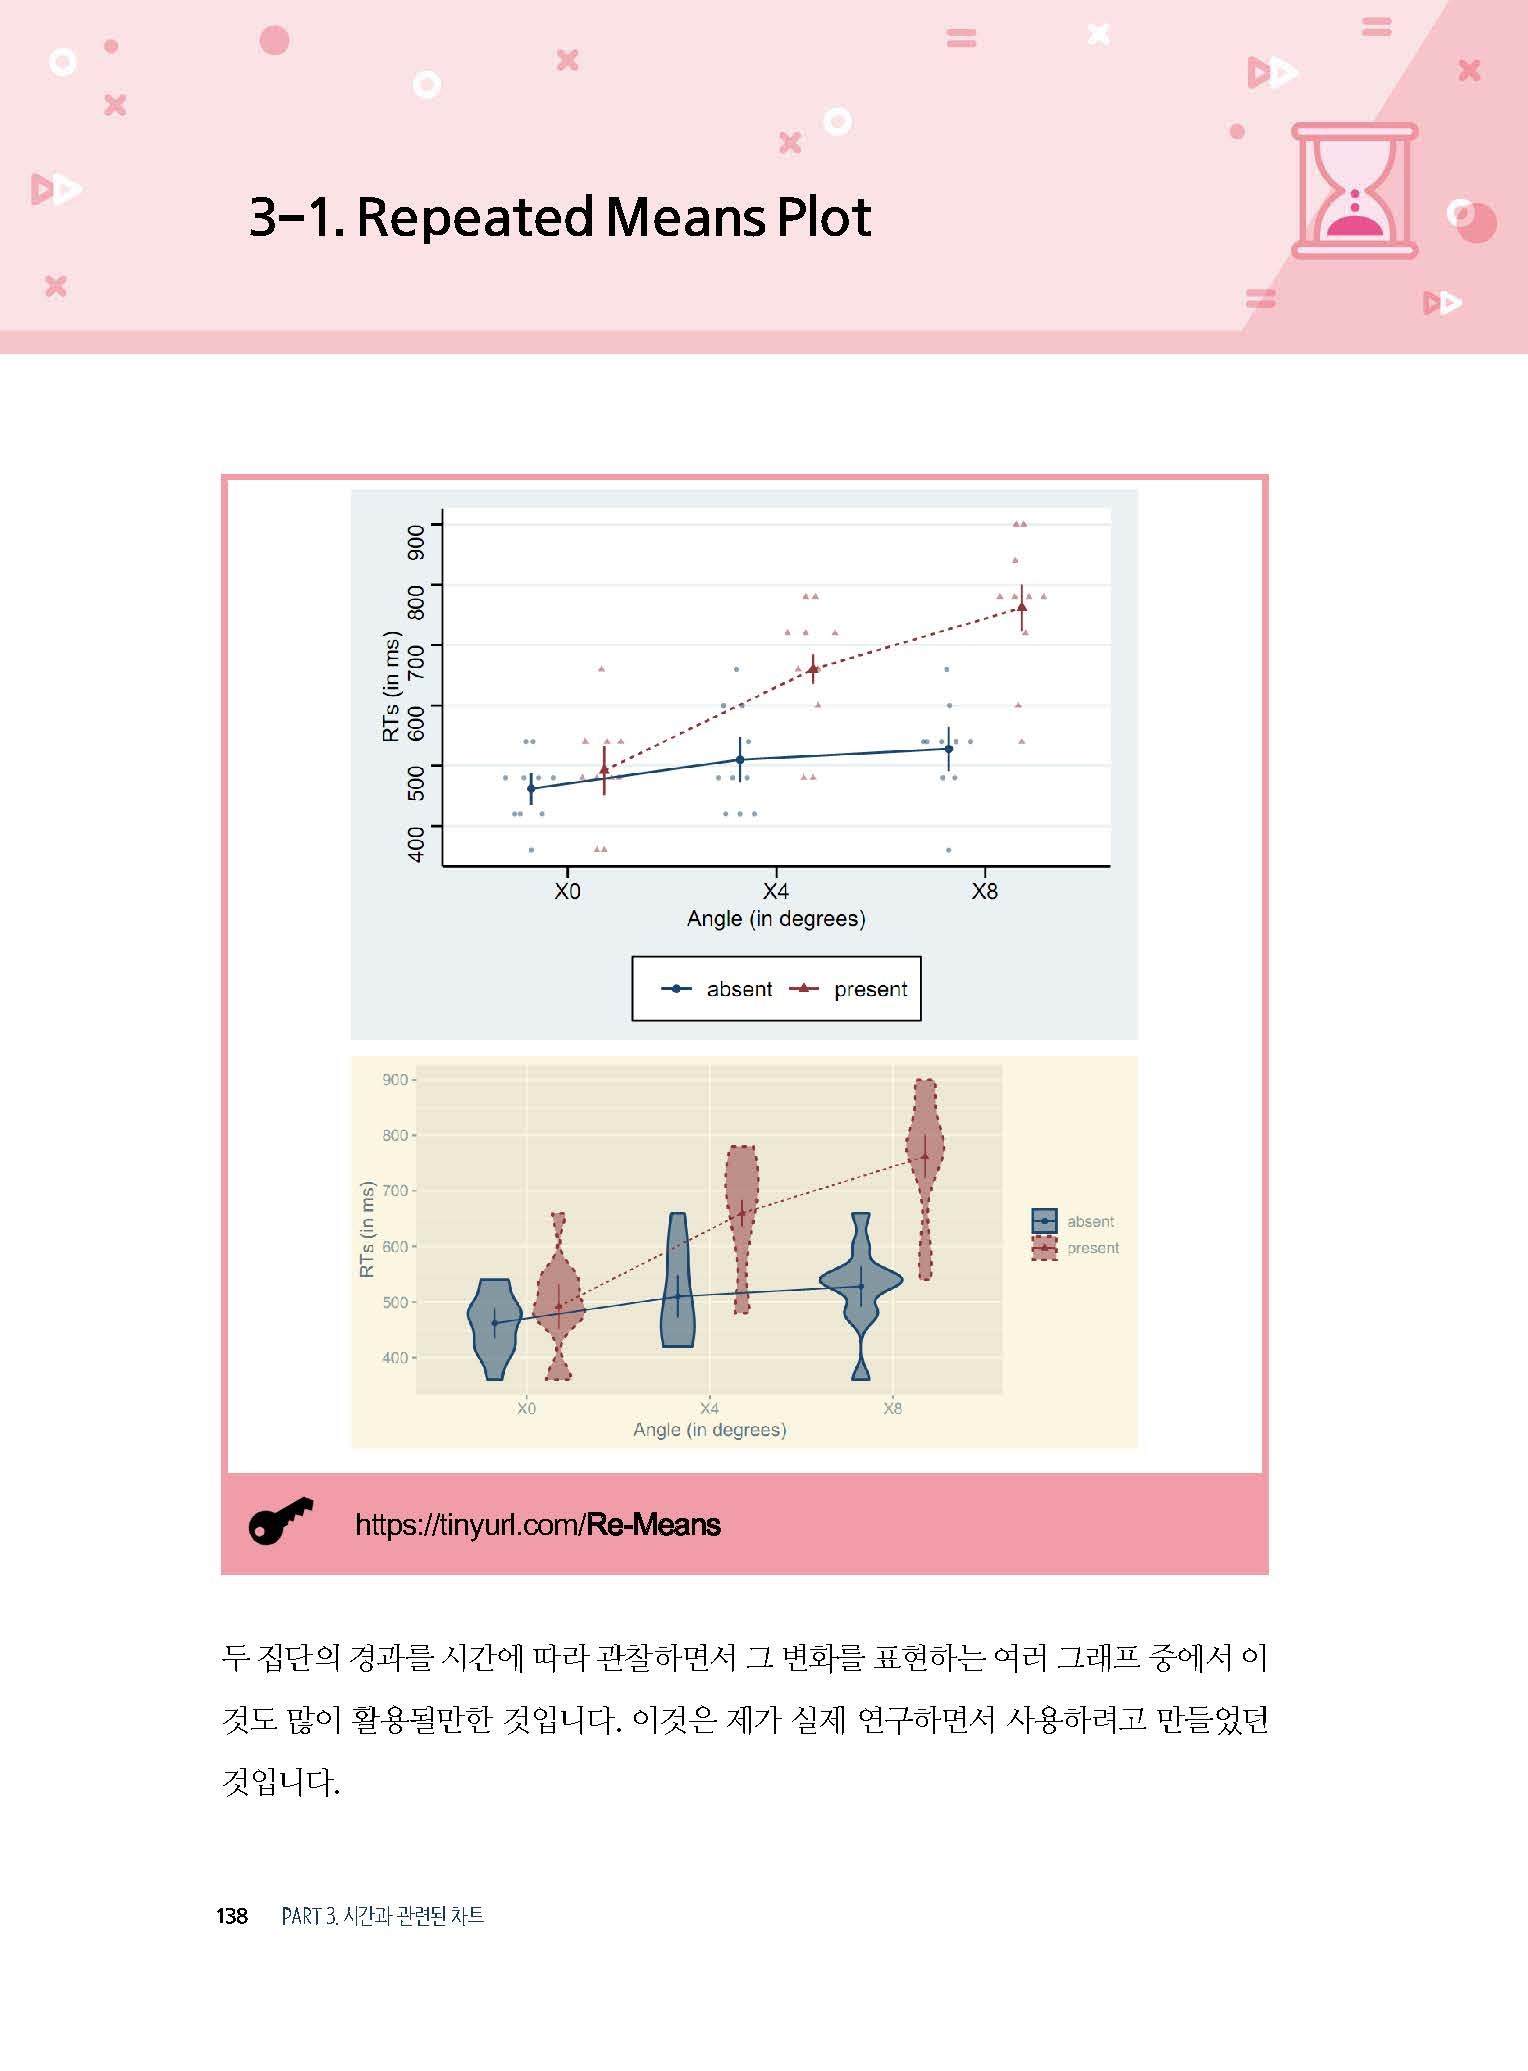
3-1. Repeated Means Plot
3-2. Many Repeated Means Plot
3-3. Summary Plot
3-4. Aggregate Plot
3-5. Horizon Plot(III)
3-6. Peak Valley Plot(Radiation)
3-7. Max Point line plot
3-8. Detecting Anomalies in Data
3-9. Recurrence Plot
3-10. Swimmer Plot
3-11. Multiple Change Points
3-12. Finding Inflection Points
3-13. Inflection from GAM fit
3-14. Climate Graph
3-15. Plots for Time & State
3-16. Surveillance Graph
3-17. Monthly & Yearly Calendars
3-18. Calendars and Gannt Chart
3-19. D) Timeline
3-20. Gantt Chart
3-21. Event Chart
3-22. Cosinor Regression Model
3-23. Chronological Plot
3-24. Bump Chart(II)
3-25. Multiple Run Charts
3-26. SPC charts for NHS
3-27. Body Weight with ID
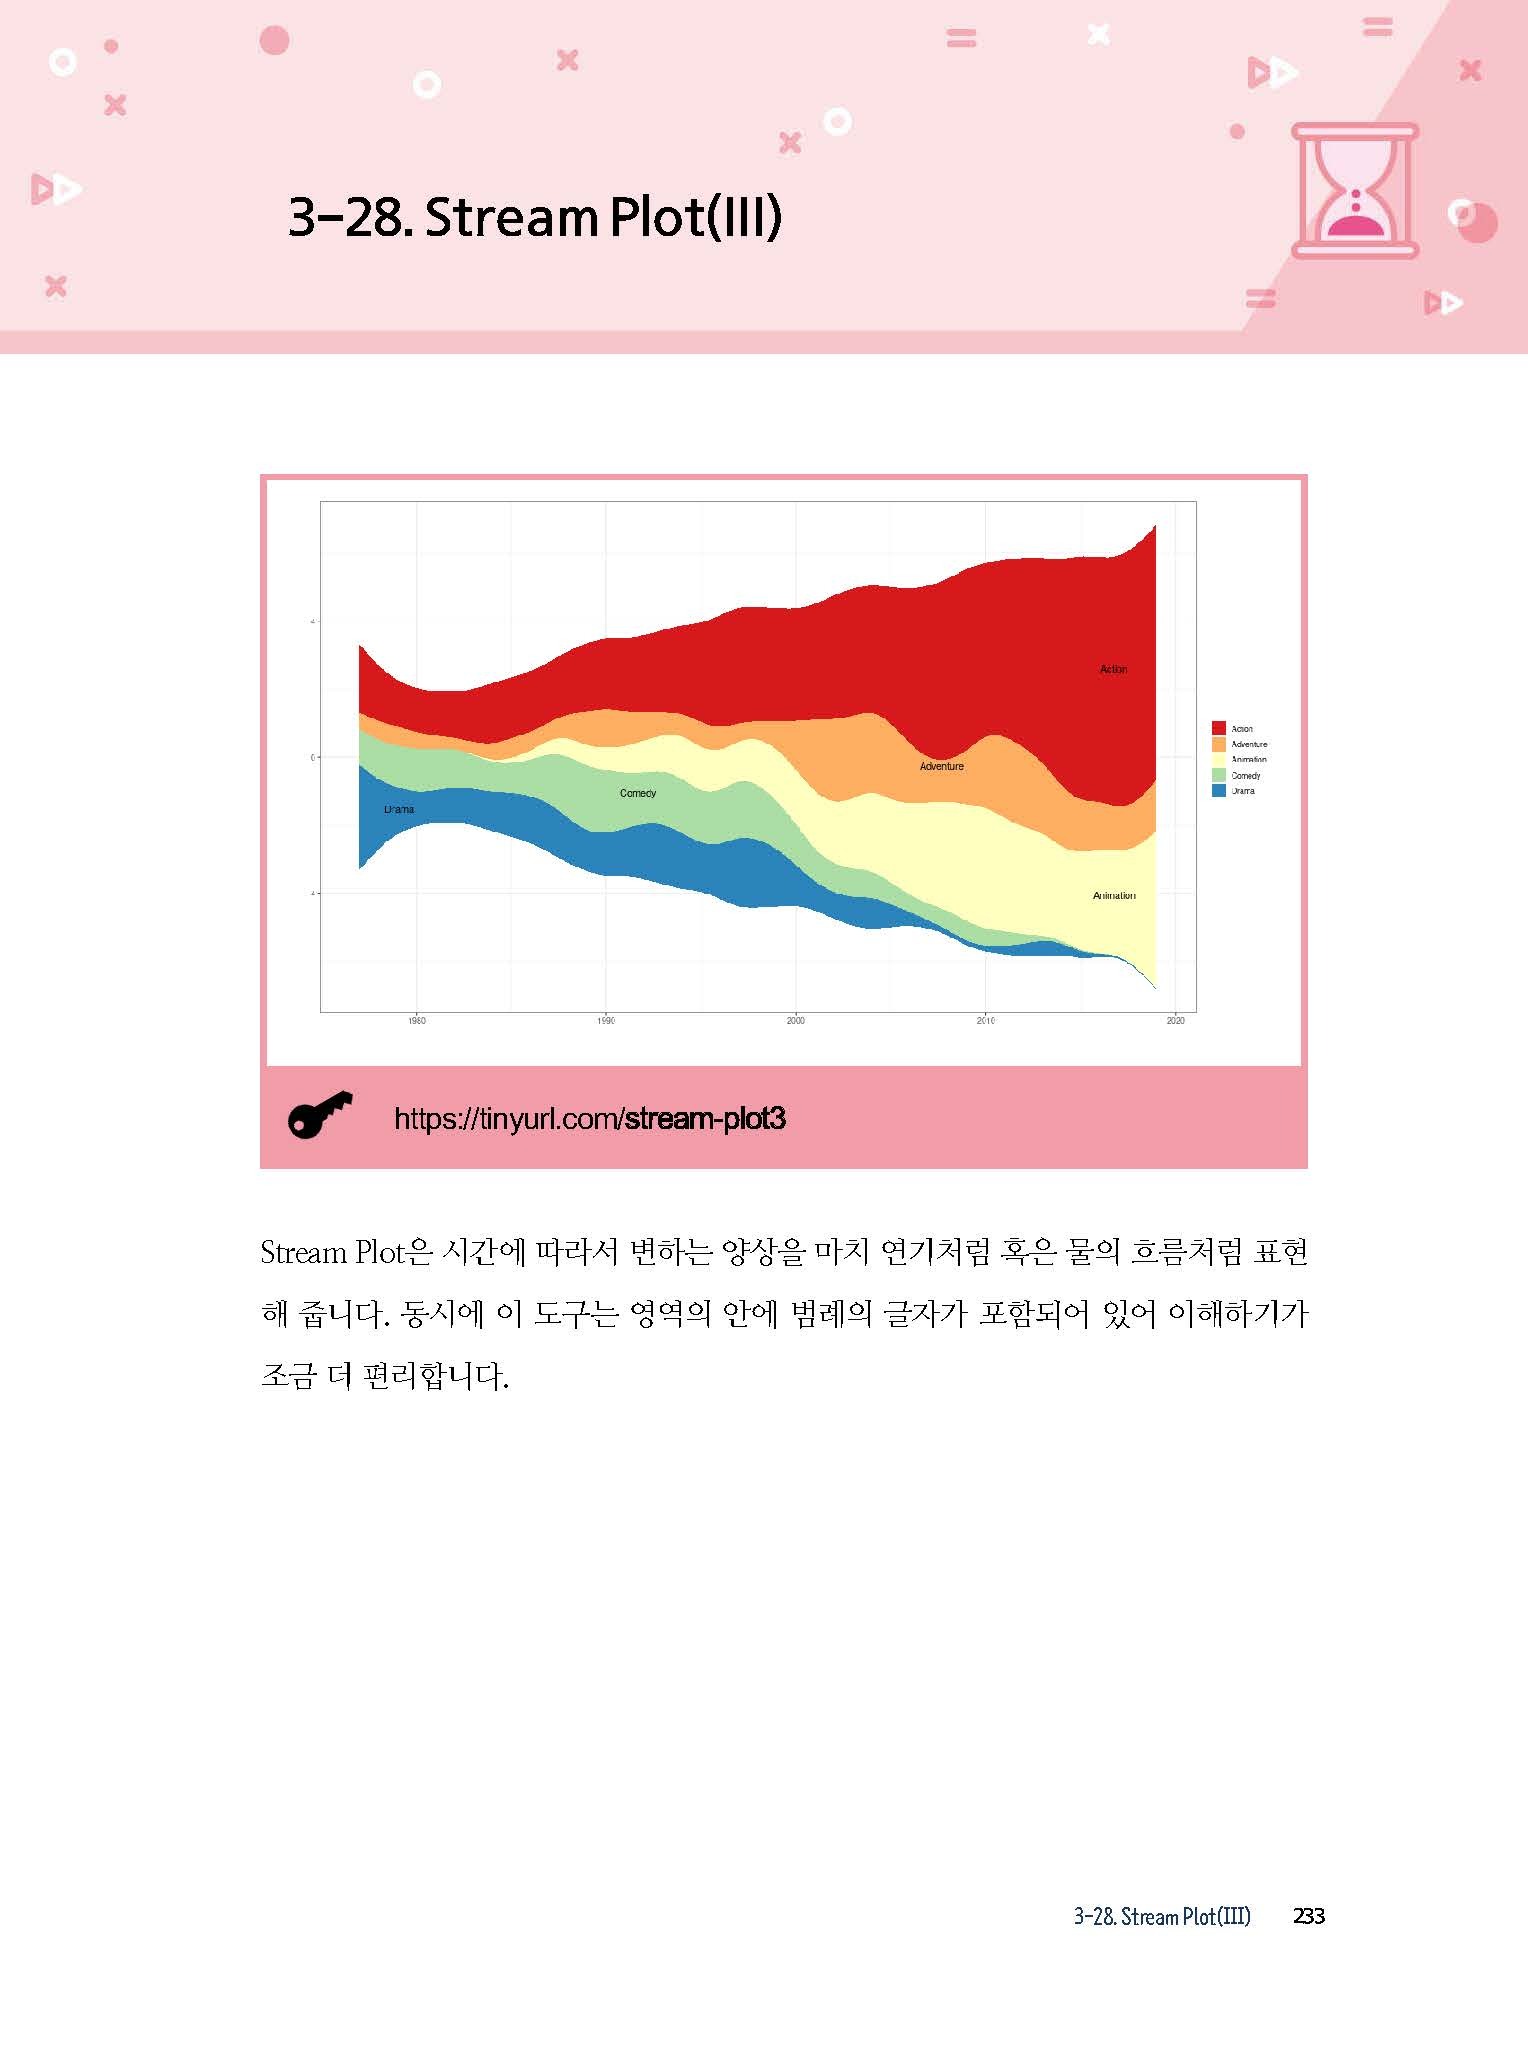
3-28. Stream Plot(III)
3-29. Comparative Line Plot
3-30. Google Trends
3-31. Forecast Murphy Diagrams
3-32. Lexis diagram(2)
3-33. Trajectory Clustering
PART 4 지도
4-1. Flights Plots
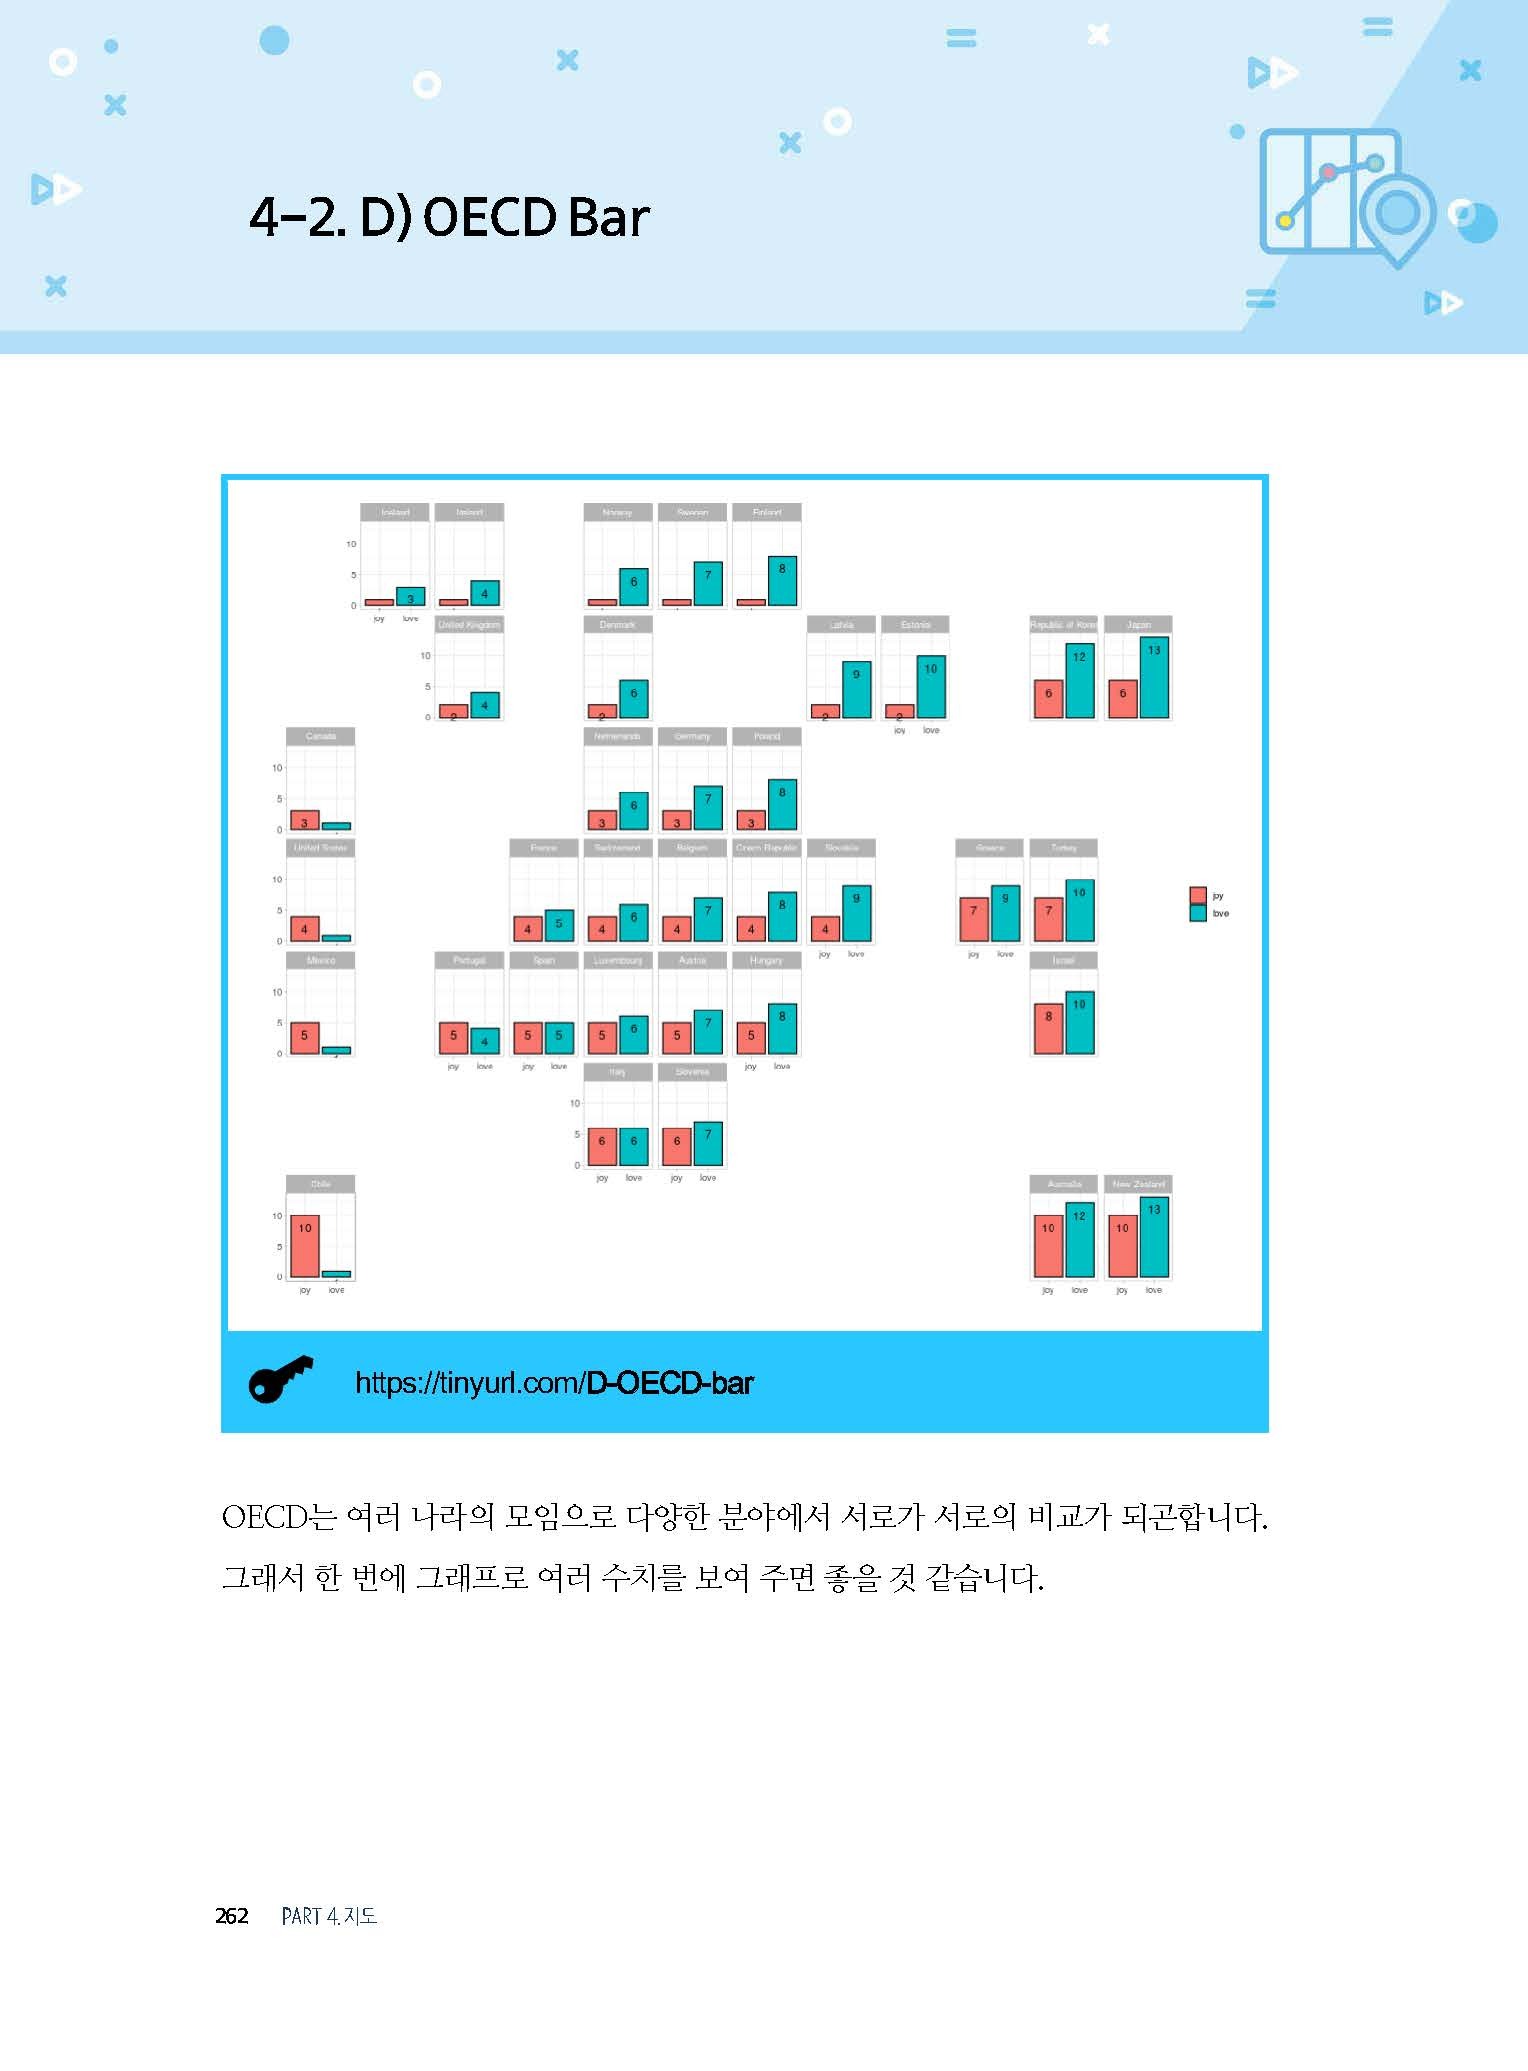
4-2. D) OECD Bar
4-3. D) EU Bar
4-4. D) Japan Bar
4-5. D) South East Asian Bar
4-6. D) USA Bar
4-7. D) Korea-sido Bar Chart
4-8. D) Seoul Bar Chart
4-9. D) Seoul Line Chart
4-10. Quiver Wind Plot
PART 5 유전과 인간
5-1. Haplotypes in a cell
5-2. Nucleobase Plot
5-3. Lollipop for Mutation
5-4. Population Genetics
5-5. D) Pedigree Chart
5-6. D) Pyramid Chart
5-7. D) Dual Pyramid Chart
5-8. D) Compare Populations
5-9. MA plot
5-10. Gene Ontology Bubble Plot
5-11. GO(gene ontology) Plot
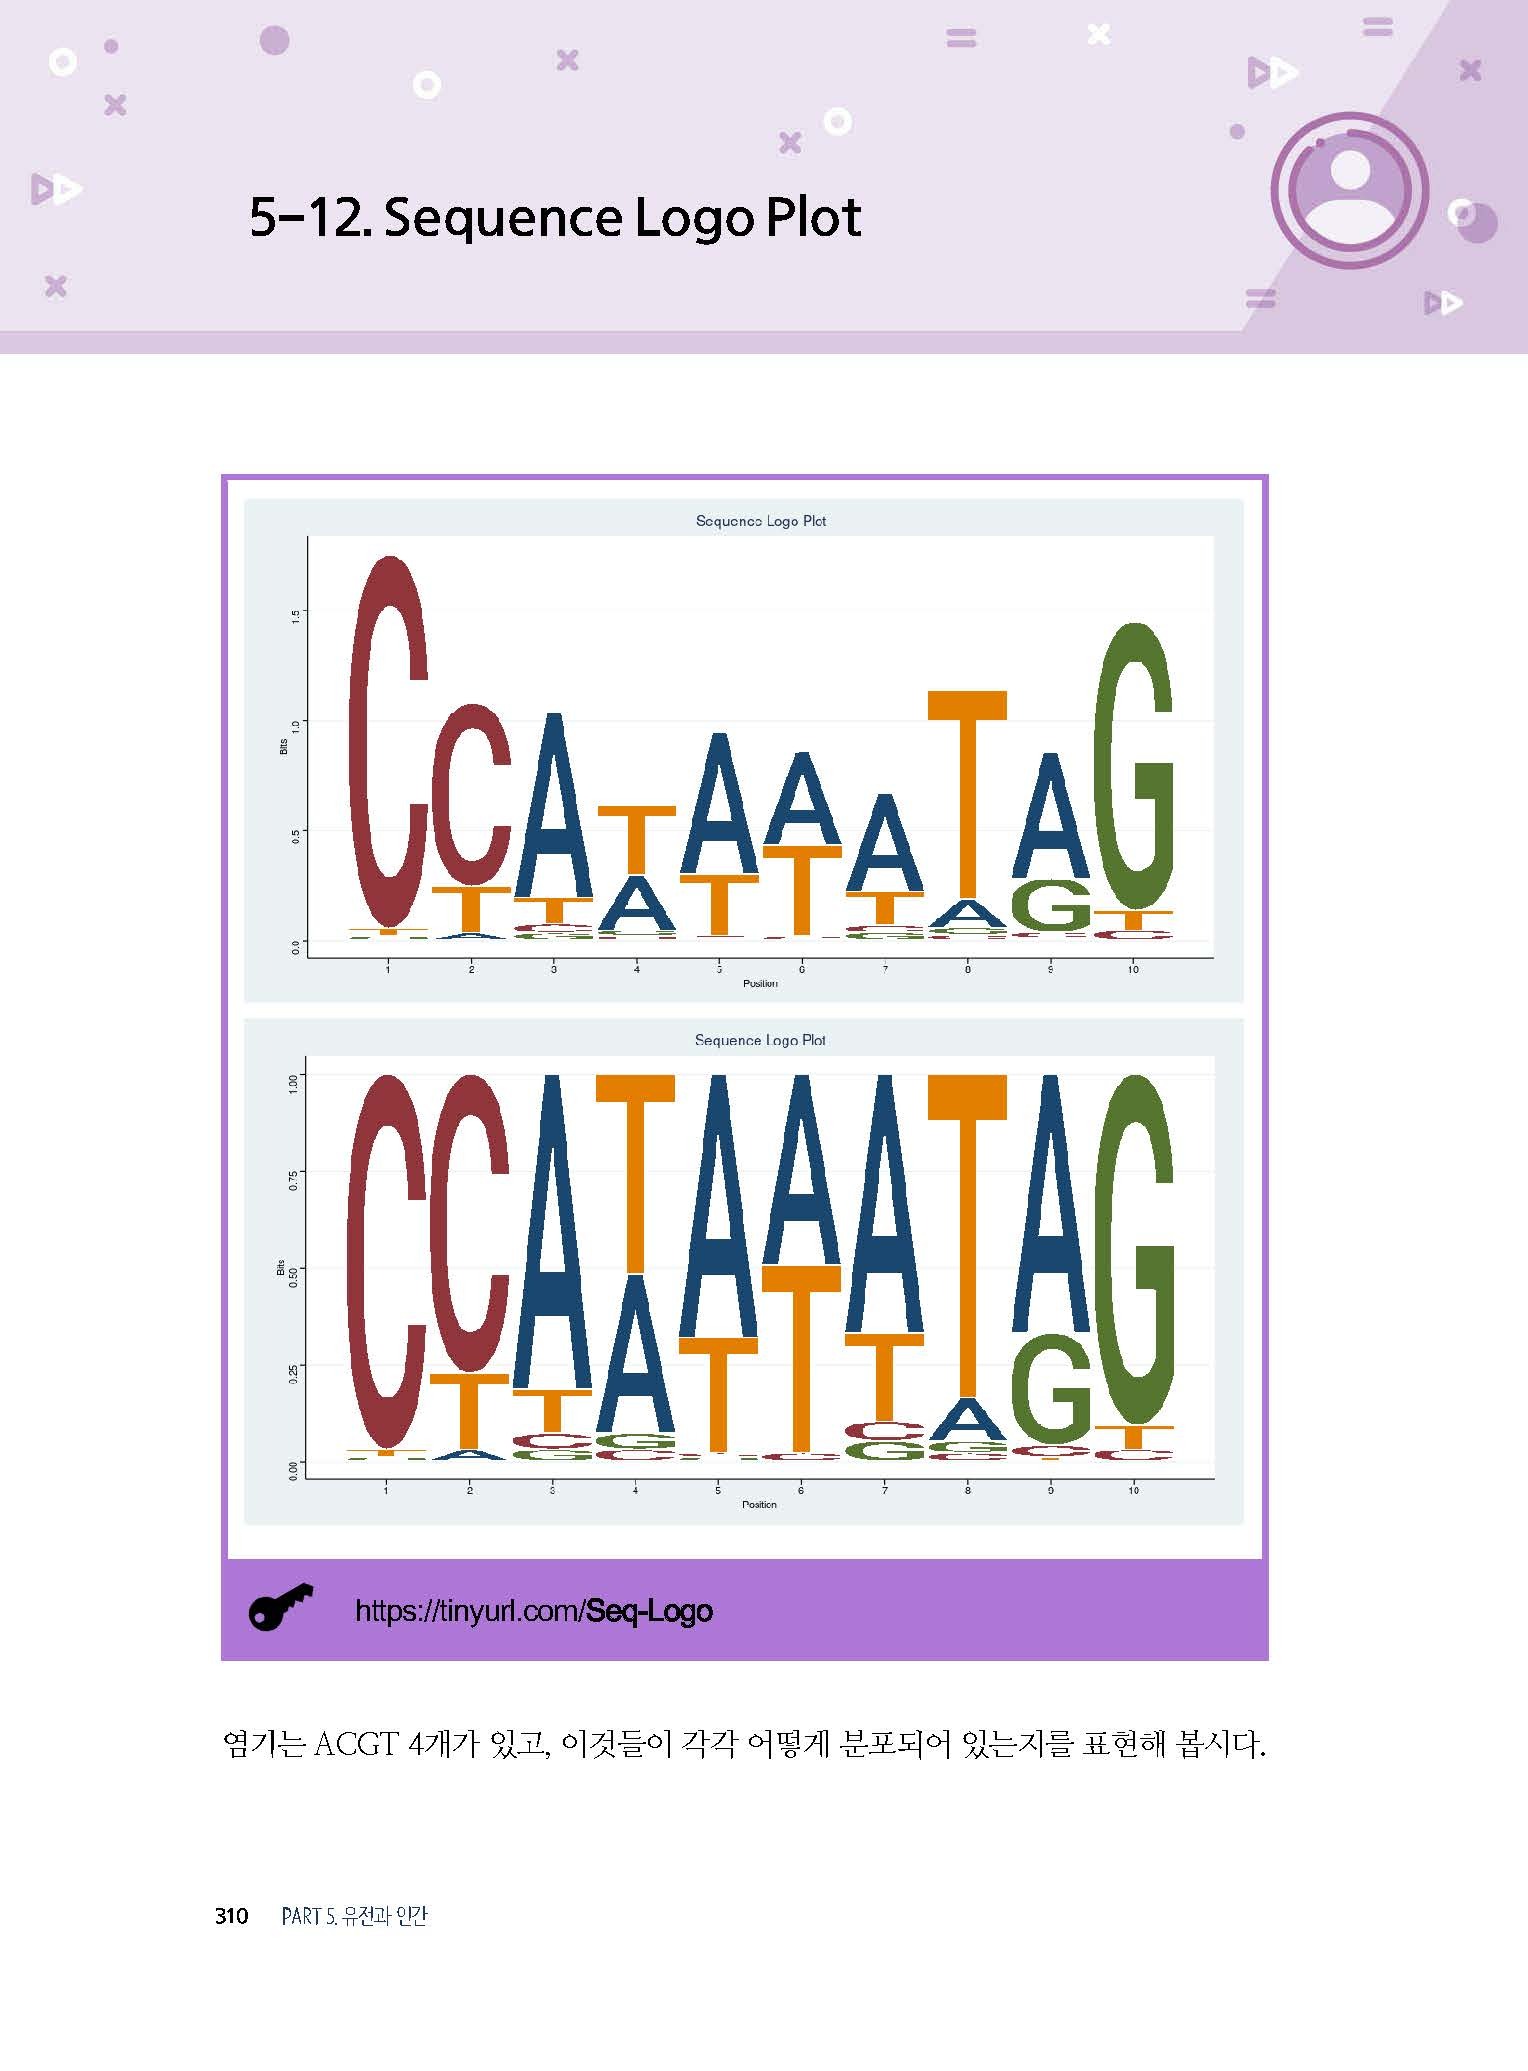
5-12. Sequence Logo Plot
5-13. Sequence Letter Plot
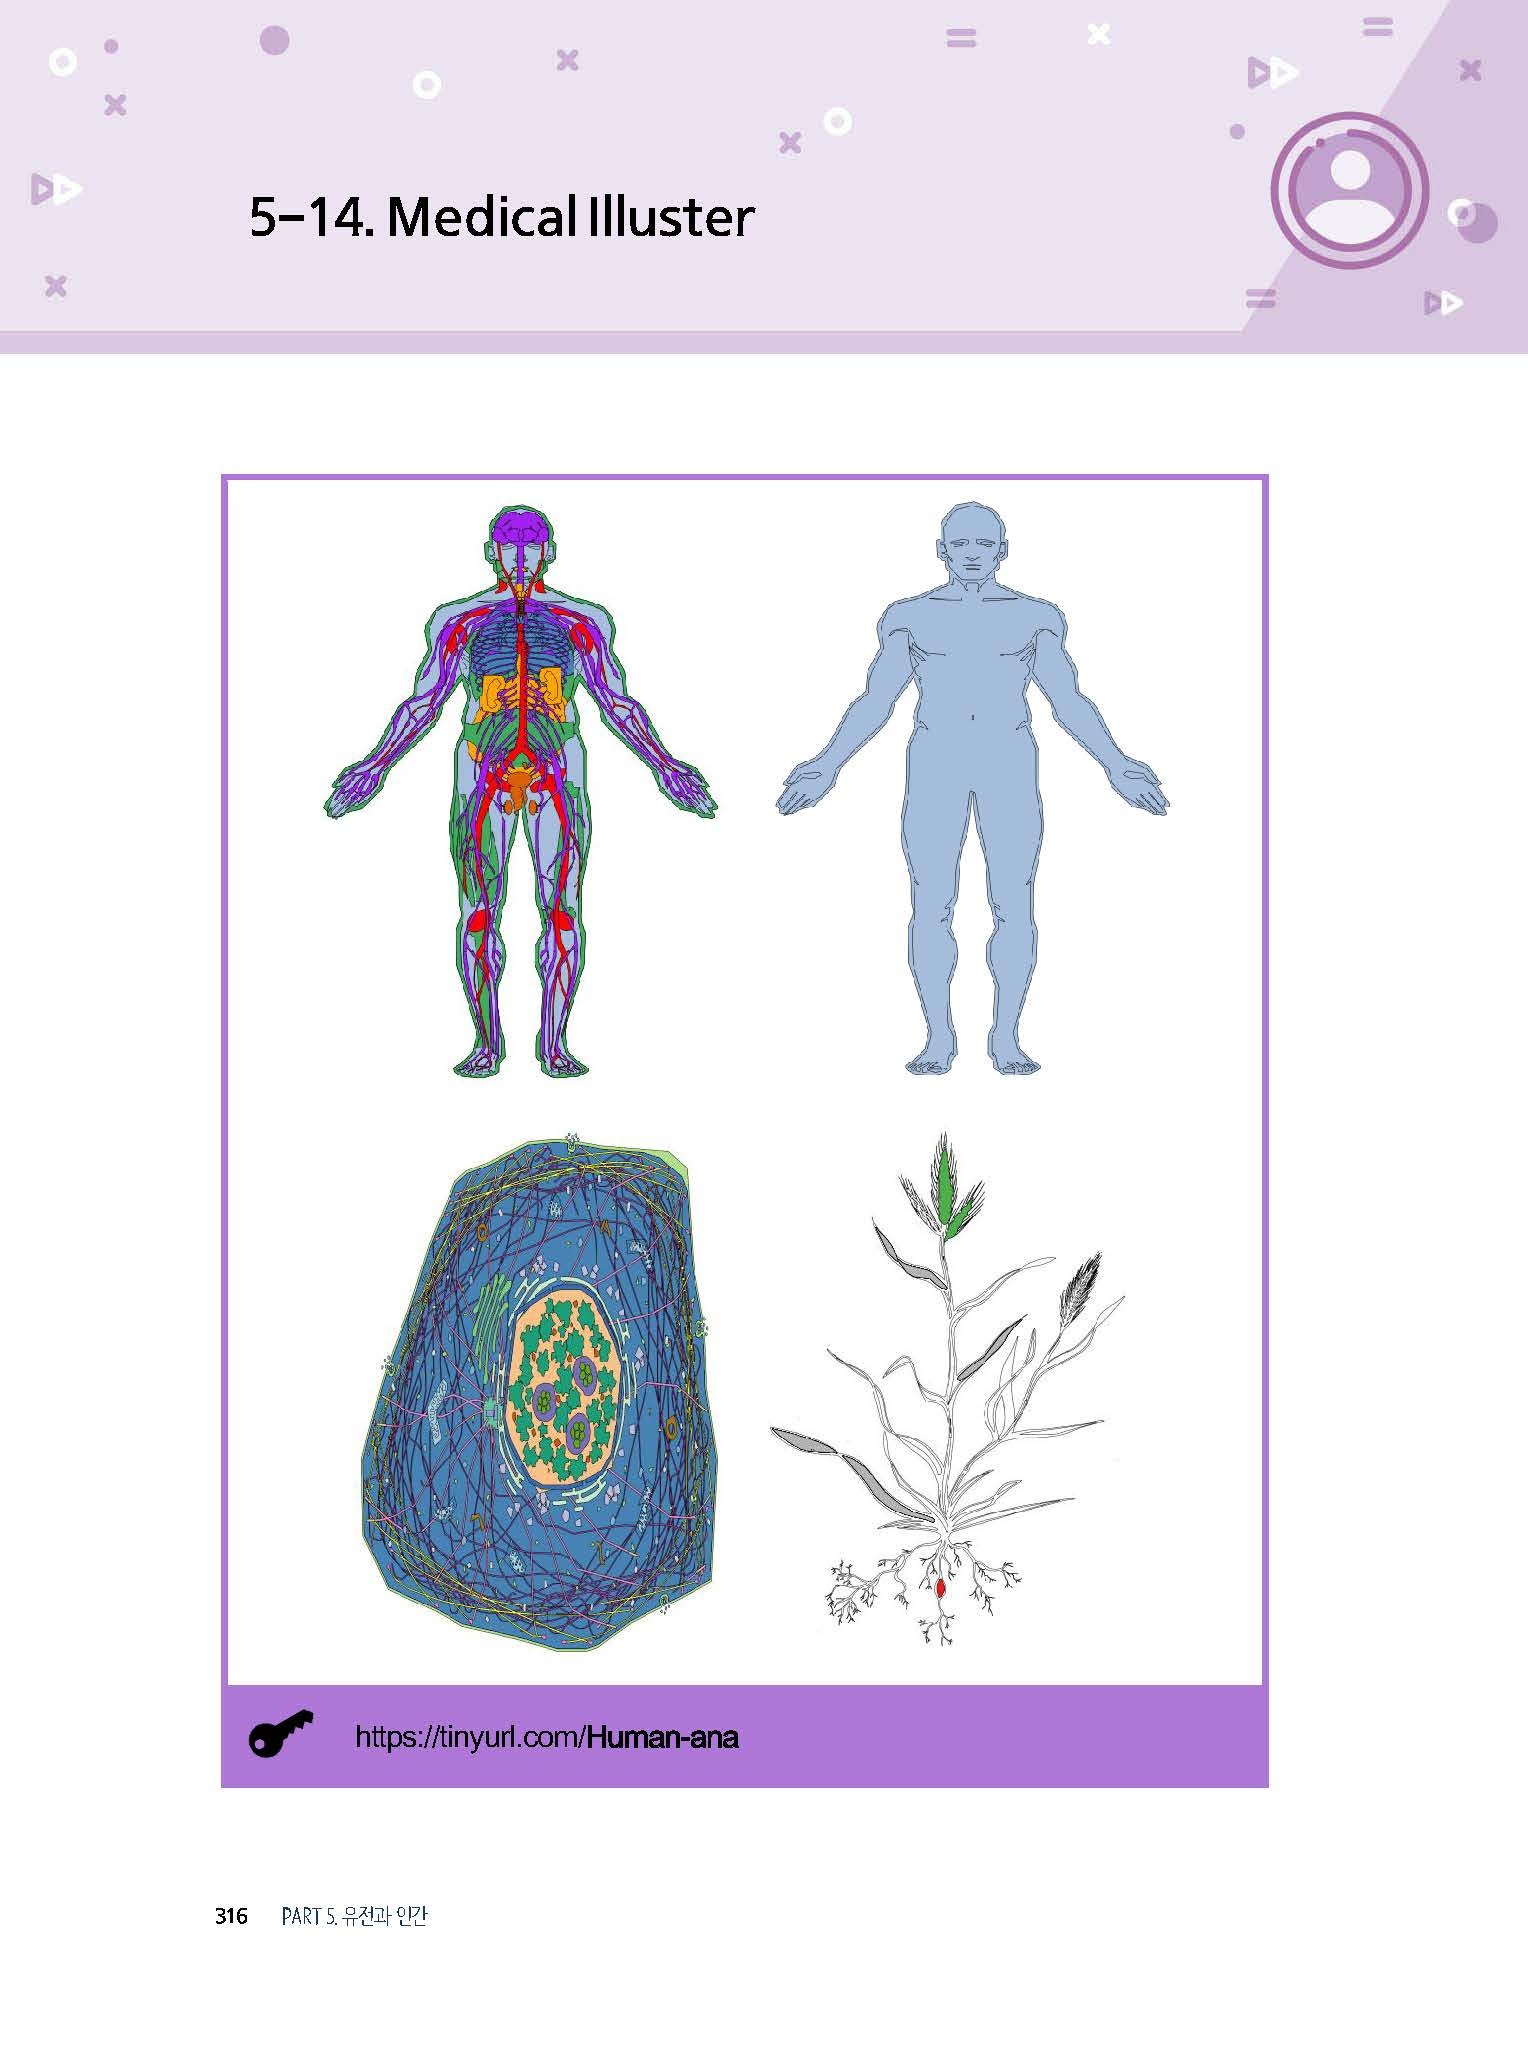
5-14. Medical Illuster
5-15. Blood Pressure Study
5-16. Growth Charts
5-17. Growth Curves
5-18. Cancer Adverse Events
5-19. Brain Atlas
5-20. Visual Fields
5-21. Daily Physical Activity
PART 6 통계와 차트
6-1. Confidence Interval
6-2. Think-More Plot
6-3. Compare Two Correlations
6-4. PS Matching(III)
6-5. Many ROC
6-6. Benford Test
6-7. Sliding Chart
6-8. Repeated Correlation
6-9. Survival ROC
6-10. Find Missing
6-11. Missing Data
6-12. Box Cox Transformation(II)
6-13. Standardization
6-14. Fagan’s Nomogram
6-15. Agreement and Reliability
6-16. Linear Mixed Effects Model
6-17. Hierarchical cluster analysis
6-18. Supervised Heatmap
6-19. Single-Case Data Analyses
6-20. Single-Case Random Test
6-21. Relative survival
6-22. Correlation Funnel Plot
6-23. Explore Plot
6-24. Tools for regression models
6-25. Linearity Check Plots
6-26. Subgroups Forest Plot(I)
6-27. Subgroup Forest Plot(II)
6-28. Regression Discontinuity
6-29. False Discovery Rate Plot
6-30. Bias Precision Plot
6-31. Bioequivalence Study
6-32. CONSORT Diagram(I)
6-33. CONSORT Diagram(II)
6-34. Flow Diagram
6-35. Time-dependent ROC curve
6-36. Association Analysis
6-37. Plateau Chart
6-38. FF Decision Tree
6-39. PRECIS-2 & Radar Charts
6-40. 3D Volcano Plot
6-41. Adherence Plot
6-42. Mean and SD from Quantiles
6-43. 잘려진 정규분포
PART 7 발표용 plot
7-1. D) Rose Plots
7-2. D) Dynamic line chart
7-3. D) Infectious Dynamics
7-4. D) Matrix Bubble Plot
7-5. D) Pareto Plot
7-6. D) ANOVA & Kruskal-Wallis
7-7. D) Bars and Lollipops
7-8. D) Understand ROC
7-9. D) Wordcloud(I)
7-10. D) Wordcloud(II)
7-11. D) Compare Events
7-12. D) SixSigma Capability
7-13. D) SixSigma Process Map
7-14. D) Quality Improvement
7-15. D) Quality Control Charts
7-16. D) CUSUM-EWMA Chart
7-17. D) Quality Loss Function
7-18. D) Correlogram
7-19. D) Likert Chart(I)
7-20. D) Matrix Correlations
7-21. D) Cause Effect Diagram
7-22. Datasets
기타 신간의학서적과 의학도서에 관련된 문의사항은 고객센터(02-854-2738) 또는 저희 성보의학서적 홈페이지내 도서문의 게시판에 문의바랍니다.
감사합니다.
성보의학서적 "http://www.medcore.kr